懿说学区(27)
SPSS统计分析(37)距离分析
Yishuo School District (27) | SPSS Statistical Analysis (37) Distance Analysis

“分享兴趣,传播快乐,增长见闻,留下美好! 大家好,这里是小编。欢迎大家继续访问学苑内容,我们将竭诚为您带来更多更好的内容分享。
"Share interest, spread happiness, increase knowledge, and leave a good impression! Hello everyone, this is Xiaobian. Welcome to continue to visit the content of Xueyuan, and we will wholeheartedly bring you more and better content to share.
上一期,我们一起学习了偏相关分析的知识,这次,我们将要介绍的是距离分析。
In the last issue, we learned about partial correlation analysis together. This time, we will introduce distance analysis.
首先,距离分析是对观测量之间相似或不相似程度的一种测量,是计算一对观测量之间的广义距离。这些相似性或者距离测量可以用于其他分析过程,例如因子分析、聚类分析或多维定标分析,有助于分析复杂的数据集。例如,是否可以根据汽车的一些特性,如发动机的大小、MPG和马力来测量两种汽车的相似性?通过计算汽车间的相似性,可以对这些汽车获得一定的认知,还可以考虑对相似性使用分层聚类或多元定标分析。
First of all, distance analysis is a measurement of the degree of similarity or non similarity between two observation measurements. It is to calculate the generalized distance between two observation measurements. These similarity or distance measurements can be used in other analysis processes, such as factor analysis, cluster analysis or multidimensional calibration analysis, to help analyze complex data sets. For example, can we measure the similarity of two vehicles according to some characteristics of the vehicle, such as engine size, MPG and horsepower? By calculating the similarity between cars, we can get a certain understanding of these cars, and we can also consider using hierarchical clustering or multivariate calibration analysis for similarity.

「SPSS」
距离测量分为非相似性测量和相似性测量两种。距离又分为个案之间的距离和变量之间的距离两种。距离分析中不存在假设检验问题,主要是通过SPSS自动计算变量或个案之间的相似性或不相似性距离,根据其计算距离值的大小来确定变量或个案之间的相似性或不相似性的强弱。
Distance measurement can be divided into non similarity measurement and similarity measurement. Distance can be divided into two types: distance between cases and distance between variables. There is no hypothesis testing problem in distance analysis, which is mainly to automatically calculate the similarity or non similarity distance between variables or cases through SPSS, and determine the strength of the similarity or non similarity between variables or cases according to the size of its calculated distance value.
让我们来看一个距离分析的实例:已知我国四城市2004年各月的日照时数如下表所示,请分析各城市日照数是否近似。(数据来源:《2005年中国统计年鉴》)

Let's look at an example of distance analysis: the sunshine hours of four cities in 2004 are known as follows. Please analyze whether the sunshine hours of each city are similar. (Data source: China Statistical Yearbook 2005)
实例分析
第一步,分析,这是四个城市的日照时数是否相似的问题,可用距离分析法实现,既可以计算其相似性测量,也可以计算其不相似性测量。我们分别定义变量“月份”、“北京”、“天津”、“石家庄”、“大连”,录入数据并保存。

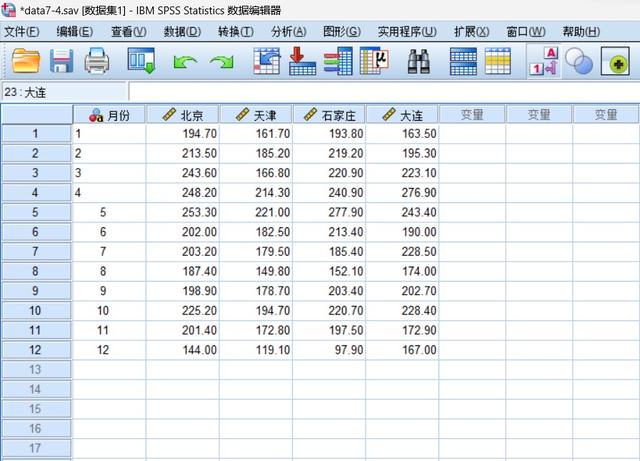
The first step is to analyze whether the sunshine hours of the four cities are similar. It can be realized by distance analysis method, which can calculate both their similarity measurement and their dissimilarity measurement. We define the variables "month", "Beijing", "Tianjin", "Shijiazhuang" and "Dalian" respectively, enter the data and save them.
第二步,设置距离分析主对话框,选择菜单“分析->相关->距离”,弹出下图所示对话框,我们将四个变量移入“变量”框中进行相似性测量计算;在“计算距离”组中选中“变量间”单选框,进行变量间的距离分析;在“测量”单选框组中选择“非相似性”,求解其非相似性测量。

Step 2: Set the main dialog box of distance analysis, select the menu "Analysis ->Correlation ->Distance", and the dialog box shown in the figure below pops up. We move the four variables into the "Variables" box for similarity measurement calculation; Select the "Between Variables" radio box in the "Calculate Distance" group to analyze the distance between variables; Select "Non similarity" in the "Measurement" radio box group to solve its non similarity measurement.
第三步,按下图所示设置非相似性测量方法。
Step 3: Set the non similarity measurement method as shown in the figure below.

第四步,主要结果与分析,距离分析的结果表是一个对称矩阵,两变量的欧氏距离越大,说明其差别越大,反之则越小。从表中可以看出“北京”和“大连”的日照数最为接近,而“北京”和“天津”的日照数相差最大。


The fourth step is the main results and analysis. The result table of distance analysis is a symmetric matrix. The greater the Euclidean distance between the two variables, the greater the difference. On the contrary, the smaller the difference. It can be seen from the table that the sunshine numbers of "Beijing" and "Dalian" are the closest, while the sunshine numbers of "Beijing" and "Tianjin" differ the most.
下期预告:本期,我们学习了距离分析
的知识与应用。下一期,我们将会进入
下一个章节,学习回归分析
的相关知识。
Preview of the next issue: In this issue, we learned the knowledge and application of distance analysis. In the next issue, we will go to the next chapter to learn about regression analysis.
今天的分享就到这里了
如果您对今天的文章有独特的想法
欢迎给我们留言
让我们相约明天
祝您今天过得开心快乐!
That's all for today's sharing. If you have unique ideas about today's article, please leave us a message. Let's meet tomorrow. I wish you a happy day today!
E
N
D
参考资料:百度百科,《SPSS 23 统计分析实用教程》
翻译:百度翻译
本文由learningyard新学苑原创,部分文字图片来源于他处,如有侵权,请联系删除
,


